Category Archives: Utilities

Slowy app Real-world connection simulator and bandwidth limiter

So anyone working with web knows that websites speed – and internet speeds – are important to retain clients/visitors.

I probably gonna start to work with a client from Colombia – not drugs related – that needs to ensure that his website and content is optimized to his main clients – colombian people – who at the top, have 2Mb internet connection – and I might need to limit my internet connection to that speed (and lower) to study the website strangulation.

I will use Slowy app Real-world connection simulator and bandwidth limiter.

slowyapp

Continue reading Slowy app Real-world connection simulator and bandwidth limiter

PHP DropBox Backup Uploader: Backup local files as a ZIP archive to Dropbox


This class can backup local files as a ZIP archive sent to Dropbox

It handles the OAuth authorization process to obtain a token to access an API on behalf of the current Web user.

The class create a ZIP archive with files from a directory to backup.

The ZIP archive is sent to the DropBox server using requests sent to is API.

http://www.phpclasses.org/package/8922-PHP-Backup-local-files-as-a-ZIP-archive-to-Dropbox.html

Fabric, the easiest way to build the best apps, from Twitter


Crashlytics

Introducing the most powerful, yet lightest weight crash reporting solution.


Beta by Crashlytics

The Most Seamless Beta Distribution Experience for You and Your Testers.

We applied the Crashlytics expertise to beta distribution. The result: a streamlined solution for distributing apps that gives you a single, cross-platform toolset for iOS and Android, and a delightful, effortless onboarding for your testers.


Sign in with Twitter

The fast and safe way for people to sign in to your app or website.


Growth, simplified.

Finally, user onboarding that helps you grow your app.

Tweet Embeds

The easiest way to bring Twitter content into your app.

Answers by Crashlytics

No Analysis Required.

Finally, mobile app analytics you don’t need to analyze. Built into our existing, award-winning Crashlytics Kit.


Mopub

Maximize your mobile ad revenue.


Apache or nginx real-time log analysis

Real-time log analysis through a Dashboard

GoAccess‘ dashboard gives you an overview of server metrics by displaying summaries of different reports as panels on a single scrollable view.


Logstalgia is a website traffic visualization that replays or streams web-server access logs as a pong-like battle between the web server and an never ending torrent of requests.

Requests appear as colored balls (the same color as the host) which travel across the screen to arrive at the requested location. Successful requests are hit by the paddle while unsuccessful ones (eg 404 – File Not Found) are missed and pass through.

The paths of requests are summarized within the available space by identifying common path prefixes. Related paths are grouped together under headings. For instance, by default paths ending in png, gif or jpg are grouped under the heading Images. Paths that don’t match any of the specified groups are lumped together under a Miscellaneous section.


Tools to monitor a Redis database?

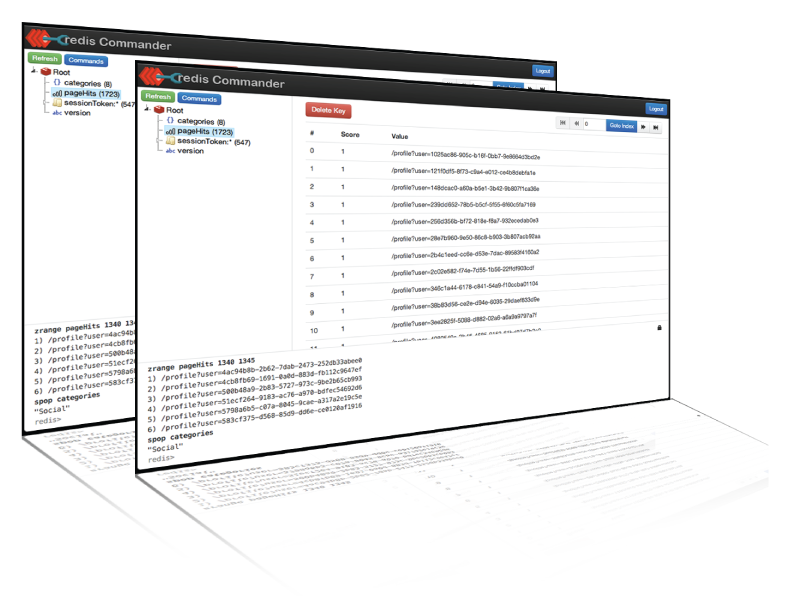
Redis Commander

Redis-Commander is a node.js web application used to view, edit, and manage a Redis Database

http://joeferner.github.io/redis-commander/


Redmon

Simple sinatra based dashboard for redis. After seeing the fnordmetric project I was inspired to write this. Some of the ideas there have be carried over here.

https://github.com/steelThread/redmon


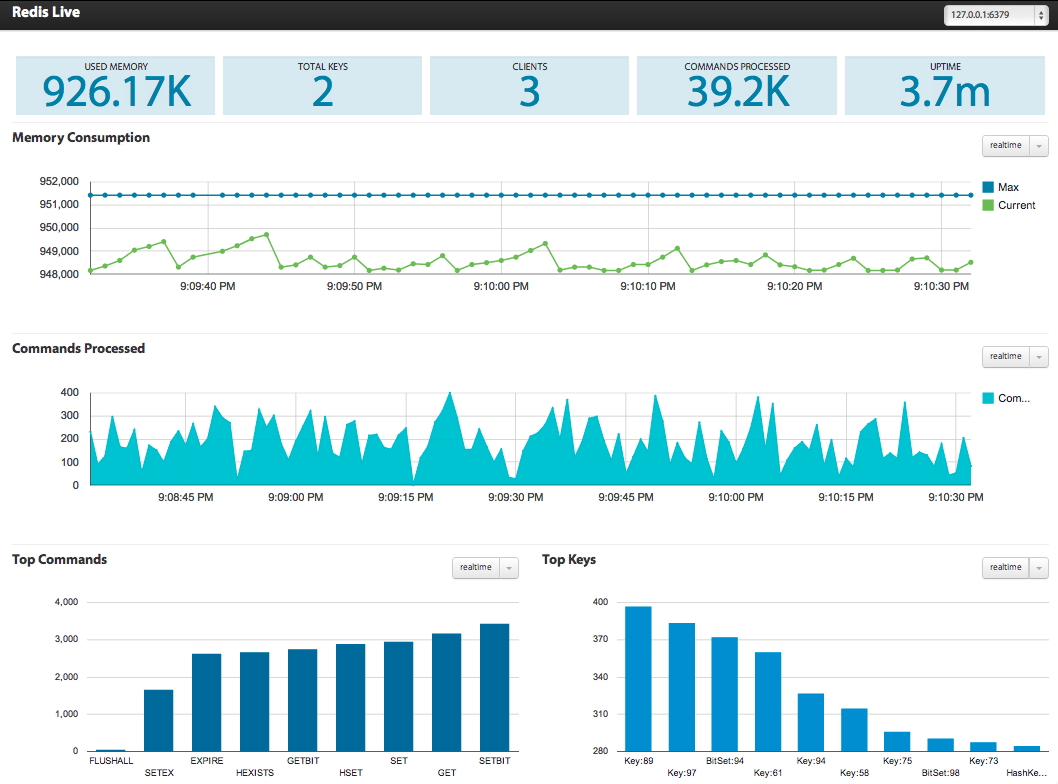
Real time dashboard for redis

I often find myself wondering how our redis instances are being used and which areas of the application are the heavy consumers. It’s also useful to predict how the memory consumption is growing over a period of time. Luckily, redis offers a couple of commands, INFO and MONITOR that expose some useful bits of information. Using the data from these two commands, it’s easy to build up a trend over a period of time.


http://www.nkrode.com/article/real-time-dashboard-for-redis


redis-stat

redis-stat is a simple Redis monitoring tool written in Ruby.

It is based on INFO command of Redis, and thus generally won’t affect the performance of the Redis instance unlike the other monitoring tools based on MONITOR command.

redis-stat allows you to monitor Redis instances

  • either with vmstat-like output from the terminal

  • or with the dashboard page served by its embedded web server.

https://github.com/junegunn/redis-stat


sensu – The open source monitoring framework.

Highly Composable

By providing an agent, message bus, & event processor, Sensu enables developers and operations teams to compose comprehensive telemetry systems to meet unique business requirements.

Designed for the Cloud

The Cloud introduces new challenges to monitoring tools, Sensu was created with them in mind. Sensu will scale along with the infrastructure that it monitors.

Passionate Community

The Sensu open source project is propelled by an ever growing community of passionate people, helping each other solve common problems, and working together to create solutions to new problems.

 Uchiwa -Official dashboard

http://sensuapp.org/docs/latest/dashboards_uchiwa

Continue reading sensu – The open source monitoring framework.

etsy/statsd – Network & IT Systems Monitoring

StatsD is a front-end proxy for the Graphite/Carbon metrics server, originally written by Etsy’s Erik Kastner. It is based on ideas from Flickr and this post by Cal Henderson: Counting and Timing. The server was written in Node, though there have been implementations in other languages since then.

A network daemon that runs on the Node.js platform and listens for statistics, like counters and timers, sent over UDP or TCP and sends aggregates to one or more pluggable backend services (e.g., Graphite).

We (Etsy) blogged about how it works and why we created it.


Continue reading etsy/statsd – Network & IT Systems Monitoring