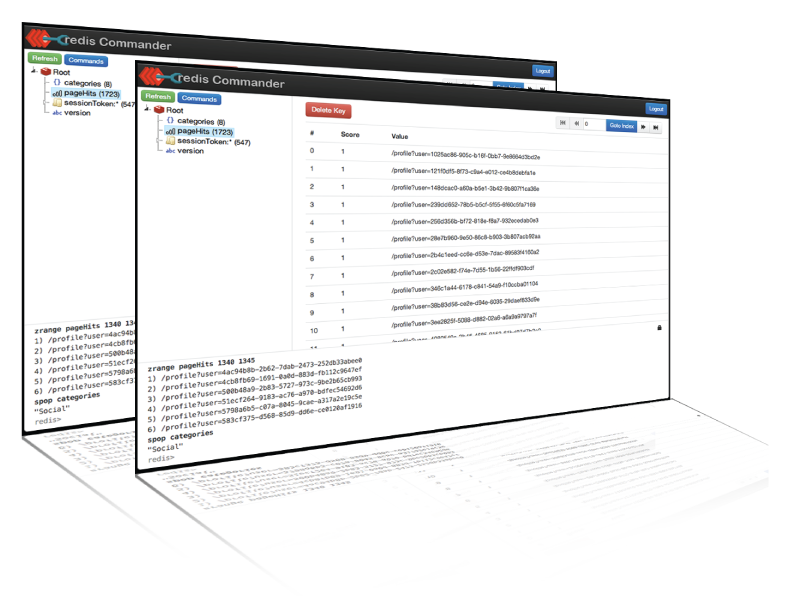
redis-commander – how to install on Utuntu 14.04 LTS

How to install it
sudo apt-get install npm
sudo chown -R $USER /usr/local
npm install -g redis-commander
ln -s /usr/bin/nodejs /usr/bin/node
redis-commander

Starting your redis-commander
redis-commander --redis-host 127.0.0.1 --redis-port 32001 -p 8081
How to access via web browser?

http://you-ip:8081

How to protect your redis-commander with a username / password

Add at the end of the redis-commander command –http-u desired-username and –http-p desired-password.

redis-commander --redis-host 127.0.0.1 --redis-port 32001 -p 8081 --http-u desired-username --http-p desired-password
References:

http://blog.biasedwalk.com/2014/02/installing-redis-commander-on-ubuntu.html
https://github.com/joeferner/redis-commander
http://www.reddit.com/r/laravel/comments/2jex9b/introducing_route_annotations_in_laravel_50/


Can’t find routes.php in Laravel 5

f*ckzzzzz!
A video on Laracast says that routes.php is inside ./app/Http/.
Can’t find it.
sh*tttzzz!

I’m trying to figure it out and update this post! 🙂

Updates!

OK!, almost 24hours later…
But!, I hadn’t been all this time looking for the solution.

YES!, I’v seen it before and tried but didn’t worked…

I was trying to use Laravel Annotation, but with no success.

OK!, heres the real sh*t.

We can have routes.php on Laravel 5 inside app/Http.

We need to active it on app/Providers/RouteServiceProvider.php, by uncomment require app_path(‘Http/routes.php’);.

You will need to update the “route:list” or what they call…
This is how…

php artisan clear-compiled
php artisan route:scan

and list them on console…

php artisan route:list

Your routes should work now.

More readings

https://laracasts.com/discuss/channels/general-discussion/route-annotation-in-laravel-5
https://laracasts.com/discuss/channels/general-discussion/informal-poll-routes-file
https://laracasts.com/series/laravel-5-from-scratch/


How to install Laravel 5 5.0-dev / 4.3

Since we need composer, lets install it.

We have to have installed curl and php-cli on our server.

  • curl
    apt-get install curl
  • php-cli
    apt-get install php5-cli

Lets now install composer.

curl -sS https://getcomposer.org/installer | php

Lets now move composer to /user/local/bin/composer so we can run it anywhere in the system.

mv composer.phar /usr/local/bin/composer

Inside the folder that we want to put Laravel 5, in my case /home/webroot/domain.com/www2/ lets run

/usr/local/bin/composer create-project laravel/laravel www2 dev-develop

Simple and fast.

(…)

Inside the folder, that we installer laravel /home/webroot/domain.com/www2 lets run

php artisan -V

HOORAY! Laravel Framework version 5.0-dev!


References

https://getcomposer.org/doc/00-intro.md#installation-nix
http://laravel.com/docs/4.2/installation
https://laracasts.com/series/laravel-5-from-scratch/episodes/2

LogicMonitor – SaS Monitoring Service


Setting up the monitoring on all of your devices may seem daunting, but auto-discovery makes it simple. There is no need to know what objects on a device to monitor, or even how to configure them. All you need to know is the hostname or IP address, and Active Discovery does the identification and configuration. Some of the items that it looks for on each device include:

  • Interfaces
  • Volumes
  • Physical disks
  • Temperature sensors
  • Virtual IPs
  • VPN links
  • DSU/CSUs
  • Applications

Continue reading LogicMonitor – SaS Monitoring Service

Tools to monitor a Redis database?

Redis Commander

Redis-Commander is a node.js web application used to view, edit, and manage a Redis Database

http://joeferner.github.io/redis-commander/


Redmon

Simple sinatra based dashboard for redis. After seeing the fnordmetric project I was inspired to write this. Some of the ideas there have be carried over here.

https://github.com/steelThread/redmon


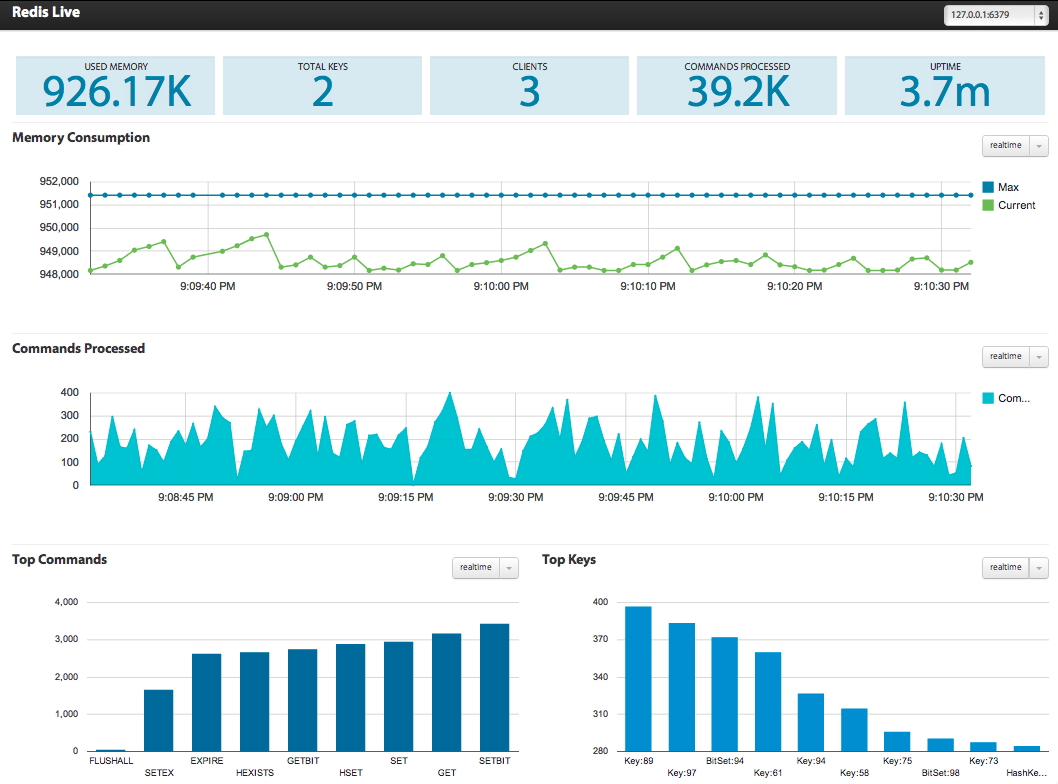
Real time dashboard for redis

I often find myself wondering how our redis instances are being used and which areas of the application are the heavy consumers. It’s also useful to predict how the memory consumption is growing over a period of time. Luckily, redis offers a couple of commands, INFO and MONITOR that expose some useful bits of information. Using the data from these two commands, it’s easy to build up a trend over a period of time.


http://www.nkrode.com/article/real-time-dashboard-for-redis


redis-stat

redis-stat is a simple Redis monitoring tool written in Ruby.

It is based on INFO command of Redis, and thus generally won’t affect the performance of the Redis instance unlike the other monitoring tools based on MONITOR command.

redis-stat allows you to monitor Redis instances

  • either with vmstat-like output from the terminal

  • or with the dashboard page served by its embedded web server.

https://github.com/junegunn/redis-stat


sensu – The open source monitoring framework.

Highly Composable

By providing an agent, message bus, & event processor, Sensu enables developers and operations teams to compose comprehensive telemetry systems to meet unique business requirements.

Designed for the Cloud

The Cloud introduces new challenges to monitoring tools, Sensu was created with them in mind. Sensu will scale along with the infrastructure that it monitors.

Passionate Community

The Sensu open source project is propelled by an ever growing community of passionate people, helping each other solve common problems, and working together to create solutions to new problems.

 Uchiwa -Official dashboard

http://sensuapp.org/docs/latest/dashboards_uchiwa

Continue reading sensu – The open source monitoring framework.

etsy/statsd – Network & IT Systems Monitoring

StatsD is a front-end proxy for the Graphite/Carbon metrics server, originally written by Etsy’s Erik Kastner. It is based on ideas from Flickr and this post by Cal Henderson: Counting and Timing. The server was written in Node, though there have been implementations in other languages since then.

A network daemon that runs on the Node.js platform and listens for statistics, like counters and timers, sent over UDP or TCP and sends aggregates to one or more pluggable backend services (e.g., Graphite).

We (Etsy) blogged about how it works and why we created it.


Continue reading etsy/statsd – Network & IT Systems Monitoring

Sh*ts that I install on every new server to run wordpress and laravel

  • whois
  • htop
  • iotop (monitorize disk IO)
  • iostat (sysstat – monitorize disk IO)
  • fail2ban
    • sendmail
    • iptables-persistent
  • nginx
  • mysql
  • php-fpm
    • php5-mysql
    • php5-gd
    • php5-json
    • php5-curl
    • php5-mcrypt
    • libssh2-php
    • php5-cli
    • allow short_open_tag = On on /etc/php5/fpm/php.ini
  • curl
  • vnstat
  • vnstati
  • at
    • edit /etc/at.allow and /etc/at.deny to allow/deny specific users


– too much IO stats? IO is important!, if we are serving thousands of files per hour.


ssdvirtual


Continue reading Sh*ts that I install on every new server to run wordpress and laravel